Idiogram Viewer

The Idiogram Viewer tool can be used to visualize the locations of the current sequences superimposed on the chromosomes of the organism's genome (assuming that all the sequences originate from the same genome build).


Only the sequences that are currently displayed in the main visualization panel will be shown on the chromosomes, so the tool can be used in conjunction with e.g. the Sequence Browser tool to only display a subset of the sequences (such as sequences that have certain properties in common, etc.). Each sequence is visualized as a colored rectangle spanning the sequence region, which in effect usually amounts to a thin vertical line if the sequence is short.

Pointing the mouse at the location of a sequence within a chromosome will display a tool tip with information about the sequence (or multiple sequences if they overlap), and double-clicking on a sequence will bring up a dialog showing all the properties of that sequence. While pointing the mouse at a sequence, you can also press the H-key to hide that sequence, the O-key to only show that sequence (and hide all the others) and the M-key to put a mark on that sequence (press the U-key to unmark it). You can also press SHIFT+S or SHIFT+H to respectively show or hide all sequences, and SHIFT+M and SHIFT+U to mark and unmark all sequences.

Pressing the "Save Image" button will allow you to save the idiogram image to file in PNG-format. The image will be saved exactly as it is rendered, but you can adjust the way the idiogram appears as described in the next section.

Controlling the visualization

Pressing the "Show Controls" button at the bottom of the dialog will toggle the visibility of the controls panel on the right which allows you to control how the idiogram and sequences are visualized.
The chromosomes themselves can be displayed in one of four different styles:

Full This style will display the two arms of the chromosome as separate regions connected by a centromere rendered as two opposing pink triangles.
The individual cytobands within the chromosome are drawn in different shades of gray.
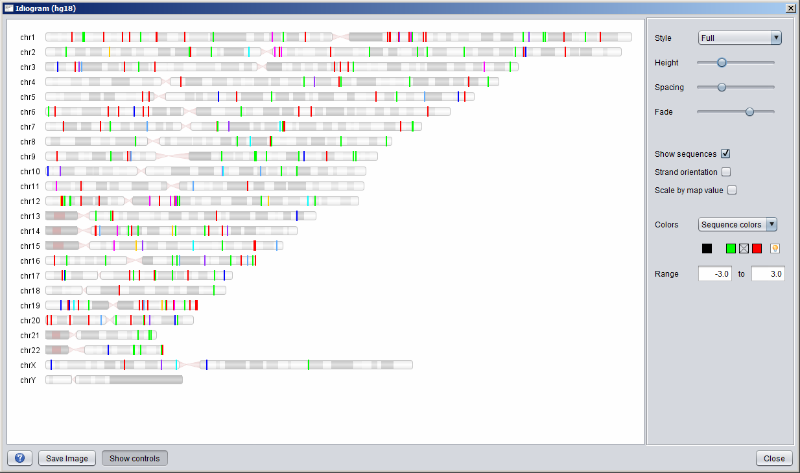
Without cytobands This style is the same as "Full" except that the individual cytobands are not shown.
Box The whole chromosome is displayed as one simple gray box with the centromere region indicated in pink.
Line The chromosome is displayed as a plain black horizontal line bounded by short vertical lines at either end. The centromere region is indicated in red.

The chromosomes will always be scaled lengthwise to fit the width of the display area, so the only way to control the width of the image is thus to adjust the width of the IdiogramViewer dialog itself.
Other aspects of the chromosomes can be controlled with the three slider controls located beneath the "style" drop-down menu: The remaining controls all affect how the sequence regions are drawn on top of the chromosomes:
Sequence colors
The colors used to draw the sequences can be controlled with the "Colors" drop-down menu. If you select the first option, "Selected color", all sequences will be drawn in the same color, which is the color of the leftmost rectangle beneath the drop-down menu. You can change this color by clicking on the rectangle to bring up a color menu. The second option in the Colors menu, "Sequence colors", will draw the sequences in the same colors as their labels in the main Visualization panel. You can change the label color of sequences in many ways. One way is to right-click directly on the sequence label in the Visualization panel and select "Set Label Color" from the context menu. Another way is to right-click on a Sequence Collection in the Data Objects panel and select "Set Label Color" from the context menu. This will set the label color for all the sequences in that collection. You can also select individual sequences from any table listing sequences and right-click to change the label colors of those.

If you have created any Sequence Numeric Maps these will also appear as options in the Colors drop-down menu, and you can choose to color the sequences along a gradient according to their values in these maps. Select the map you want to use and specify your color gradient by clicking the three rectangles in the middle below the Colors menu. The first of these controls the color to use for the largest negative number in the map, the middle rectangle controls the color to use for the value zero and the last rectangle controls the color for the largest positive number. Hence, if you have chosen the colors green, white and red and the values in the Numeric Map range from -1.0 to +1.0, the sequences will be colored according to a gradient that looks like this:


If you select the special color "transparent" for the zero value, sequences with small values will be more transparent and hence less visible in the image.

When you select a new Sequence Numeric Map from the Colors drop-down menu, the range of the color gradient will be automatically updated so that the leftmost color will correspond to the largest negative value and the rightmost color will correspond to the largest positive value. However, it is possible to adjust this range afterwards by manually increasing or decreasing the two extreme values. If you set the minimum or maximum value in the range to a new value with smaller magnitude, all sequences that fall outside of the range in the positive or negative direction will be assigned the same "extreme color" in that direction.

The color gradient will usually be a linear transition between the selected colors, but if you feel that this makes the colors in the lower end of the spectrum appear too "dim", you can brighten the colors by activating the lightbulb icon (this will in effect log-transform the gradient).

Configuring cytoband data

The first time you view the idiogram of particular genome, MotifLab will attempt to download cytoband data for that genome build from the UCSC Genome Browser. The data will be cached locally for quicker access the next time you use the tool. If Motiflab is unable to obtain the correct data automatically, or if you just want to supply your own cytoband files for a genome, you can do so by selecting the Idiogram Viewer in the Plugins dialog (available from the Configure menu) and then press the "Configure" button. A popup dialog will appear listing all genome builds that have locally cached cytoband data. To use your own data files, press the "Add" button (to configure a new genome) or select a genome build from the list and press the "Edit" button. A new file dialog will appear where you can select the file that contains the cytoband data. The file should be formatted similarly to this cytoband file for hg18.