Enhancer Highlighter
The enhancer highlighter is a nifty tool that allows you to select a gene and highlight its promoter region and any distal enhancers that interact with the promoter
(interact here meaning that the enhancer and promoter are located in close spatial proximity to each other in the nucleus).
Background
The transcription of genes are controlled by transcription factors (TFs) that bind to cis-regulatory elements in the DNA sequence.
These regulatory elements include the promoter region located near the transcription start site of the gene (where the transcription preinitiation complex assembles)
and distal enhancer regions that can influence the timing and rate of transcription.
One hypothesis is that the promoter and enhancers communicate with each other through physical interaction, where the chromosome loops around to bring TFs at the enhancer
into close physical proximity with the promoter.
It is also believed that an insulator region that binds the CTCF factor can block the interaction between a promoter and an enhancer when located between them.
The figure below shows the DNA helix in black with a gene to the right (4-cyan). The promoter region is located in front of it (3-yellow), and a distal enhancer is located far upstream (2-red).
Various transcription factors (5, 6 and 7) bind to both the promoter and the enhancher regions. The DNA helix then loops around to bring the enhancer in contact with the promoter.
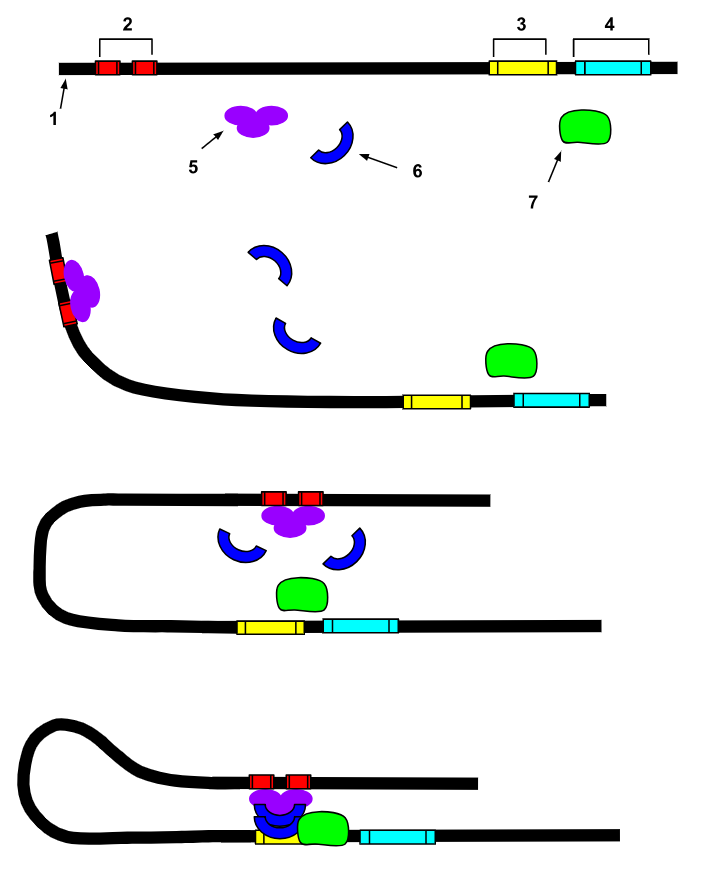
Image from Wikipedia
Using the tool
The Enhancer Highlighter can be enabled by selecting it from the Tools menu in MotifLab. This will bring up a dialog with several options. Closing this dialog will deactivate the tool.
In order to use the enhancer highlighter, you must have at least 3 region tracks containing different information:
- A gene track
- A chromatin state track
- A chromatin interactions track
An example session can be found here: https://tare.medisin.ntnu.no/motiflab/exampledata/EnhancerHighlighter_example_session.mls.
The gene track can be any track containing regions (it does not specifically have to contain gene annotations, although that is assumed).
The chromatin state track should contain a set of contiguous, non-overlapping regions that annotate the different parts of the sequence
based on their functional roles, such as e.g. regulatory regions (promoters and enhancers), transcribed regions and repressed regions.
One example of such tracks are the chromatin state segmentation tracks from ENCODE.
The chromatin interactions track should contain information about which parts of the sequence that are in close 3-dimensional spatial proximity to each other in the nucleus,
as determined by e.g. chromosome conformation capture experiments (3C, 4C, 5C, Hi-C or ChIA-PET).
This interactions track must be a nested track where each region contains exactly two nested child-regions that represent the two endspoints of the interaction.
Such tracks can be imported with the "Interactions" data format (provided that they are formatted accordingly).
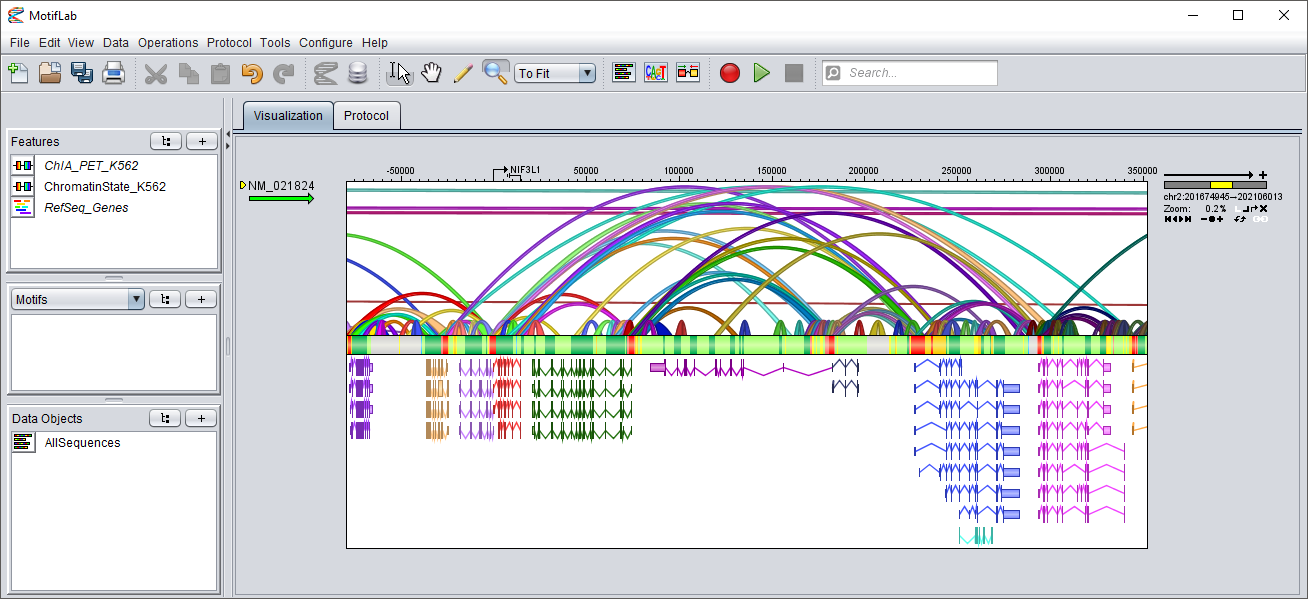
The screenshot below shows an example of three such tracks, where the chromatin state and interactions tracks are based on the K562 cell line.
In the chromatin state track in the middle, red regions denote promoters, orange and yellow are strong and weak enhancers, green regions are transcribed and gray regions are repressed heterochromatin.
Insulators are marked in blue.
The interactions track on top is visualized with the following graph settings:
nested regions are hidden (only the connectors are displayed), connectors are "scaled" and drawn in "ribbon" style, and the region scores are not visualized
(so the region height is not scaled by score, but the height of the connectors are scaled by the distance between the two endpoints).
When you click on a gene to select it, all other genes that are not selected will be grayed out. Clicking outside of any genes will clear the current selection.
Normally, the currently selected gene will be deselected if you select a new one, but if the "Allow multiple selections" option is enabled, it will be possible to select multiple genes
at the same time. Clicking once more on a selected gene will then deselect it (and clicking outside of all genes will deselect all).
Once one or more genes are selected, the tool will highlight the promoters of these genes by hiding all other regions from the chromatin state track.
The tool will then go on to examine all interactions where one end of the interaction overlaps with one of the selected promoters.
If the other end of the interaction overlaps with an enhancer region in the chromatin state track, this enhancer will also be shown along with the interaction itself.
All other interactions that do not overlap with one of the selected promoters at one end and an enhancer at the other end, will be hidden.
If the "Show all promoter interactions" option is enabled, all interactions that overlap with one of the selected promoters at one end will be shown, even if the other end does not overlap with an enhancer.
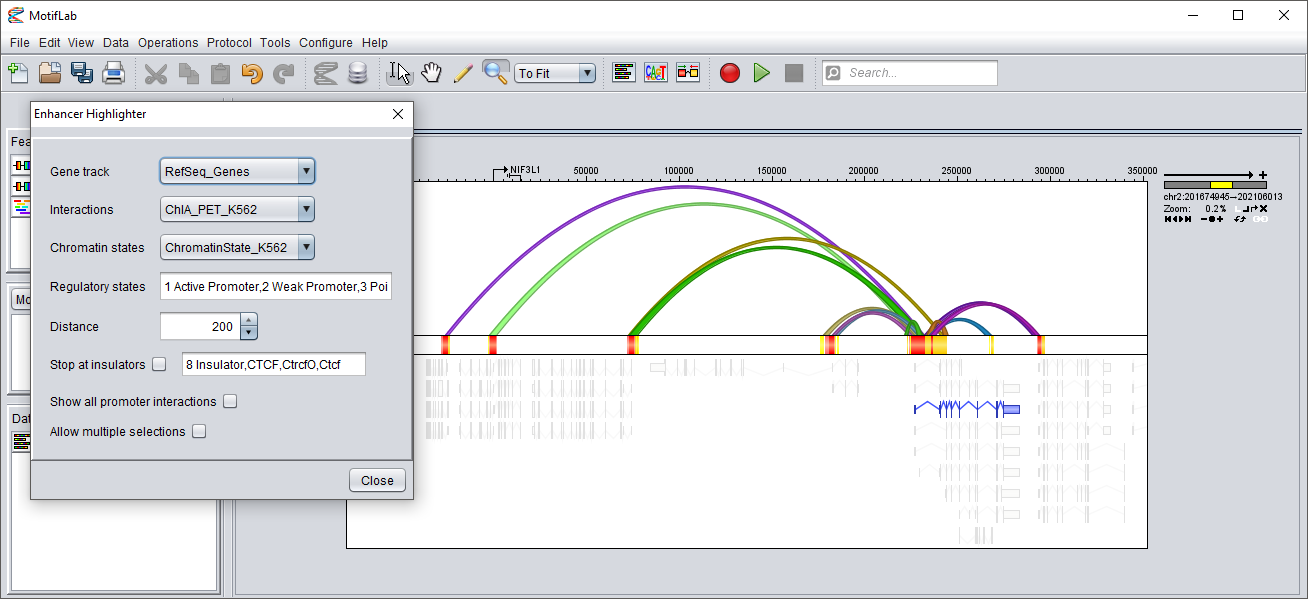
The screenshot below shows the same sequence and tracks as the one above after a single gene (blue) has been selected in the bottom track.
The TSS of this gene is at the left edge. The interactions track at the top now only shows the subset of interactions that extend outwards from the promoter of this gene and overlap with enhancers at the other end.
The chromatin state track in the middle only shows the promoter of the selected gene and the enhancers that interact with the promoter.
(Transcribed and repressed regions, plus other regulatory regions not interacting with the gene promoter have been hidden.)
How it works
Step 1: Find the transcription start site
When you click on a gene region to select it, the orientation of that region is used to determine its upstream end
which will be taken as the transcription start site of the gene.
Step 2: Determine the promoter region
Next, the chromatin state track is consulted to determine the promoter region for the selected transcript.
If the gene TSS overlaps with a chromatin region that has a promoter state (i.e. its type is one of the promoter states listed in the tool dialog) then everything is OK,
if not the process ends right away. If a potential "core promoter" is found, the tool then tries to determine the full span of the promoter,
which could include several more regulatory regions in proximity around the TSS.
The figure below illustrates the promoter region associated with a gene.
Here, the pink gene has a "direct" orientation and extends downstream to the right.
The TSS is therefore at the left edge of the gene (indicated with a black arrow).
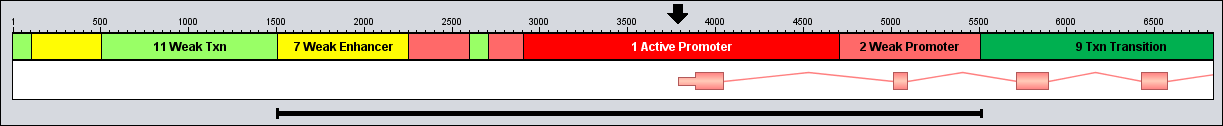
The TSS overlaps with a "1 Active Promoter" region (red) which is 1800 bp long, and this will be our starting promoter.
Working outwards in both directions, the promoter is then expanded to include the two pink regions on either side which have the type "2 Weak Promoter" (since this type is also included in the list of promoter types).
The expansion then stops in the downstream direction since the next region (dark green) is annotated as a transcribed region, and the type "9 Txn Transition" is not included in the list of promoter types.
In the upstream direction the expansion also stops, since the light green region is annotated as weakly transcribed ("11 Weak Txn").
However, this weakly transcribed region is quite narrow, and there is another weak promoter directly upstream of it. It could even be that this green region has been wrongly annotated.
So, to account for this, the tool could be allowed to continue and look at the next regions if these are not too far away from the current promoter.
This is controlled with the "distance" setting in the tool dialog.
For example, if the distance is set to 200 bp, the tool is allowed to skip over a segment no wider than 200 bp to look for more promoter regions on the other side.
In this case, the green region is only 100 bp wide so the tool may skip over it to find and include the pink weak promoter to the left.
The yellow enhancer region ("7 Weak Enhancer") located directly upstream is added next, since this type is also included in the list of promoter types by default (but you can exclude such enhancer types from the promoter list if you like).
The final promoter is indicated here by the black bar below the tracks.
If the "Stop at insulators" option is enabled in the tool dialog, the expansion process will always stop if an insulator region is encountered (these cannot then be skipped over no matter how narrow they are).
Step 3: Find other parts of the sequence that are in close physical contact with the promoter
The interactions track now comes into play. Each interaction region has two distinct endpoints, and each endpoint can be 1 bp or wider
(this is best visualized if the "draw nested regions" graph setting is enabled on the track or if the "ribbon" connecter style is used).
Interactions where at least one endpoint overlaps with the promoter region is kept and the rest are filtered out.
If both endpoints are located fully within the promoter, the interaction is also discarded (since the interaction is only internal to the promoter and does not extend beyond it).
If the "Stop at insulators" option is enabled, an interaction will also be filtered out if there is an insulator region located between the two endpoints.
Next, the endpoint overlapping with the promoter is labeled as the "promoter end" and the other endpoint is labeled as the "other end".
If both endspoints overlap with the promoter but one is located fully within the promoter while the other extends beyond it, the first is labeled the "promoter end"
and the one that extends beyond it is label as the "other end". If both endpoints both overlap with and extend beyond the promoter, both ends will be labeled as the "other end".
Step 4: Determine if any of the interacting parts are enhancers
Finally, the tool will look at the "other ends" of the interactions to see if they overlap with any potential enhancher regions,
i.e. regions whose types are included in the "enhancer states" list in the tool dialog. If no such enhancer regions are found,
the interaction will not be shown unless the "Show all promoter interactions" option is enabled.
If potential enhancers are found, they will be expanded outwards in both directions using the same procedure as described above for promoter expansion (possibly stopping at insulators).
The final enhancer candidates could thus also include enhancer regions that do not directly overlap with the interaction endpoints themselves.
Regulatory states
The lists of promoter states and enhancer states both default to the same list of regulatory states which contain both promoters and enhancers (as well as some ambiguous regulatory states).
The default list is based on annotations used in some commonly available chromatin tracks (including tracks from ENCODE):
- 1 Active Promoter
- 2 Weak Promoter
- 3 Poised Promoter
- 4 Strong Enhancer
- 5 Strong Enhancer
- 6 Weak Enhancer
- 7 Weak Enhancer
- 1_Active_Promoter
- 2_Weak_Promoter
- 3_Poised_Promoter
- 4_Strong_Enhancer
- 5_Strong_Enhancer
- 6_Weak_Enhancer
- 7_Weak_Enhancer
- Tss
- TssF
- PromF
- PromP
- Enh
- EnhF
- EnhWF
- EnhW
- DNaseU
- DNaseD
- FaireW
- TSS
- PF
- E
- WE
You can edit the lists if you like, for instance to only include promoter states for promoters and only enhancer states for enhancers.
Just remember to press ENTER inside the text field after editing to update the lists. All modifications to the lists will be lost when you close the tool dialog.